Audit, then optimize

Our platform watched live sports video streams. Each stream had to be tied to the right scheduled game, which the data companies that list those games call a fixture. Those providers each spell the team names differently, so a language model did the tying-up. We called it the matcher.
The matcher used OpenAI, and its bill was doubling about every week as we scaled, and OpenAI kept emailing to offer a higher limit. Nobody could say which call was expensive, or why. So we started an investigation.
This series has been about measuring before deciding. What 20 months of AI adoption measured did it for throughput and failure rate. This post does it for a bill.
TL;DR:
- Storing the actual calls, with their raw parameters, is what let us analyse the behaviour.
- Prompt size was always really big
- 63% of the calls were identical. We were repeating the same request, with no limit.
- The next fix cited that data as its evidence one day later
- Three fixes cut the input tokens behind each matched fixture by 88.8%.
The bill doubled, and we could not say why
Before April we had exactly two facts about the matcher. It cost real money, and the invoices were growing faster than the traffic. Neither of those tells you what to change.
The tempting response is to add a cache. That is a guess with a deploy attached. We needed to gather information first: one row per call. It carried the inputs, prompt size, candidate count, latency, model, temperature, confidence and outcome, plus a version number for the pipeline.
The three fixes
Fix 1: put a leash on the number of calls
In the first measured version, 63% of 944 production calls were byte-identical: same inputs, minutes apart.
That is not an AI problem. Retries without a ceiling pile up faster than the successes, which the AWS Builders’ Library calls retry amplification. The old fix applies: bound the retries, then collapse identical in-flight work into one call, the way Go’s singleflight does.
We did both. Identical inputs now hash to one SHA-256 key, cached for ten minutes, and the retry ceiling dropped from 10 attempts to 3.
Set the temperature to 0 as well, but do not expect determinism from it: it is a nudge, not a guarantee. Our own cache, note: prompt caching at the API discounts a repeated prefix, it does not skip the call.
Repeats fell to 10%, and this one change carried most of the total saving - a 53% improvement.
Fix 2: stop asking the model what code can already answer
Some matches need no judgment. If both team names in the stream’s title appear verbatim in a candidate fixture, code can say so. The pipeline resolves those before the prompt is built.
That removed the call entirely for 21% of the May calls (11,465 / 54,239). A deterministic short-circuit in front of an expensive step is worth hunting for early. It also shrinks the surface where a wrong answer is possible.
That’s another 21% improvement.
Fix 3: tighter prompt size by better recall@k
The remaining calls were fat rather than frequent, each prompt carrying every plausible fixture in a time window.
The fix was a dictionary. Providers write the same team differently: one feed’s “manchester united” is another’s “man utd”. Every accepted match teaches the pipeline one of those pairs.
Before the next call, both team names are looked up. If both are known, the prompt carries only the candidates they point at, plus the 5 nearest by kick-off time. That is down from up to 33.
The five extras matter: a young, wrong translation cannot hide the right answer from the model. An entry that keeps getting rejected deletes itself.
This reduced prompt size from 9k tokens to less than 1k . That’s another 80% reduction
What it saved
Across the three fixes, the estimated input tokens behind each matched fixture fell 88.8%, from 8,911 to 994. About 21% of calls stopped reaching the model at all, and the candidates in each prompt fell from 76 to 28.
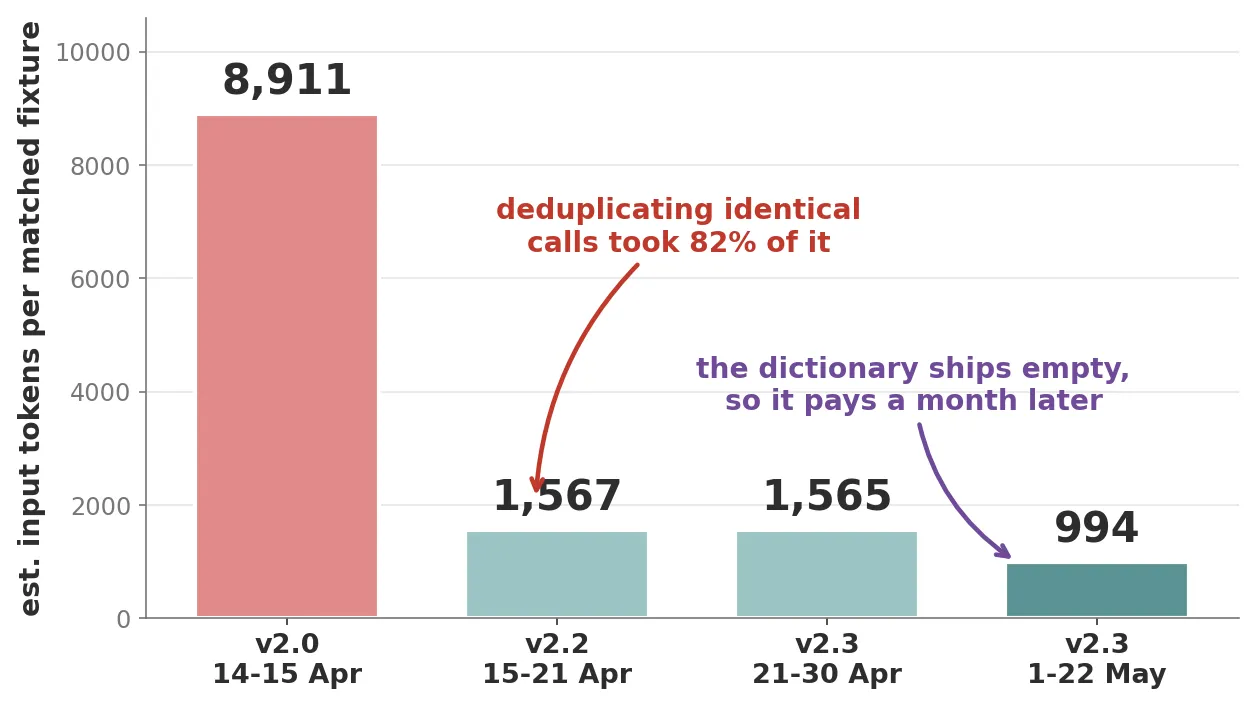
Deduplication took 82% of the waste in one step. The retrieval fix looks flat in April, because it starts empty and learns from live traffic.
| Version | Window | Calls | Repeat prompts | Candidates per call | Est. tokens per match |
|---|---|---|---|---|---|
| v2.0 | 14 to 15 Apr | 944 | 63.5% | 76.4 | 8,911 |
| v2.2 | 15 to 21 Apr | 1,434 | 10.2% | 27.6 | 1,567 |
| v2.3 | 21 to 30 Apr | 2,775 | 11.2% | 26.8 | 1,565 |
| v2.3 | 1 to 22 May | 54,239 | 11.9% | 28.6 | 994 |
This pipeline cost over $200 a month before the work and $20 after.
What this does not prove.
- Four changes shipped in eleven days, so no single fix is isolated.
- Daily call volume grew about eightfold between the two windows, so the per-call averages describe different traffic too.
- Both windows are partial: April starts on the 14th, May ends on the 22nd, when my work on the project ended.
- Tokens are estimated as characters over four, so they proxy spend rather than measure it.
The loop I would run next time
The order is the whole lesson, and we learned it backwards.
1. Improve monitoring
Log every call with more metadata than you think you need, and version it. The fields listed earlier, and then the one that is easy to skip: a version number on every row. It is the only thing that lets you compare before and after once you start changing the pipeline. Without it, the table above would be one blurred average instead of four versions. Merge it and gather some data.
2. Investigate logs, looking for the strange, not the slow
Duplicates, failures, retries, oversized context. The expensive problems here announced themselves as odd shapes in the data rather than as latency: identical rows minutes apart, a candidate count in the thirties, a provider whose similarity score was zero for every single name.
3. Fix one thing at a time, and monitor the improvement
Each of our three fixes brought a new column or counter with it. That is what turned “the bill is smaller” into “this specific change removed this specific work”, and it is also what exposed the dictionary paying nothing in its first month.
4. Repeat until satisfied
Fixes change behaviour. Initial cost was too many requests. Then it became too big prompt size. Eventually, we cached the results and skipped the LLM call for 90% of the cases. This is where we stopped
Conclusion
AI architectures follow the same paradigm as everything else we operate: measure it before you optimize it.
Charity Majors’ “instrument first” argument predates all of this, and calls to a language model are the strongest case for it I have worked on. The unit of spend is invisible, variable, and buried inside a string. A bill gives you the total. Only the rows tell you which call to delete.
What would change my mind: the deduplication cache is doing the work in this story. If another team logs their calls first and finds nothing repeated, our 63% was our retry logic, not language models. The general lesson would then be much smaller than it looks.
Methodology & limitations (click to expand)
Data sources
- Call-level data: a monthly rollup of the call-audit table, production environment only, grouped by month, pipeline version and model. Six rows covering 14 April to 22 May 2026.
- Change history: the pull-request catalogue for the backend repository, and the design record for the matching pipeline.
Definitions and bounds
- Est. tokens per match = calls x average estimated input tokens, divided by the number of matches recorded, counting every row of that version-window including the ones where no call was made.
- Repeat prompts is the share of calls whose prompt had been seen before, counting model calls only. Rows where no prompt was ever built are excluded, because they are stored as fully repeated by construction and blend the two populations into one meaningless average.
- Calls are a lower bound. The extract covers rows carrying a pipeline-version tag, and an earlier pull request cites 1,663 audit calls on 10 April, before the first row in this extract.
- The design record’s own totals for the same period include staging traffic, so they run several times higher than these production-only counts. The two should not be mixed.
- 63% is measured as 63.45% across 944 calls over two days, and the design record’s independent estimate at the time was 57 to 65%.
What this does not show
- No spend data, as noted above. An earlier post quotes a different range from the same notes, for a wider scope: the whole OpenAI bill rather than this pipeline alone.
- Match quality is not in this data. The table records what was accepted, not whether the accepted match was correct.
Get new posts by email
One email per post, about two a month. The numbers and the caveats, same as here. No sequence, no pitch, unsubscribe in one click.
Almost there. Check your inbox and click the link to confirm.
That did not go through. Try again, or email [email protected] and I will add you by hand.
No tracking pixels. I never pass the address on. How this is handled.